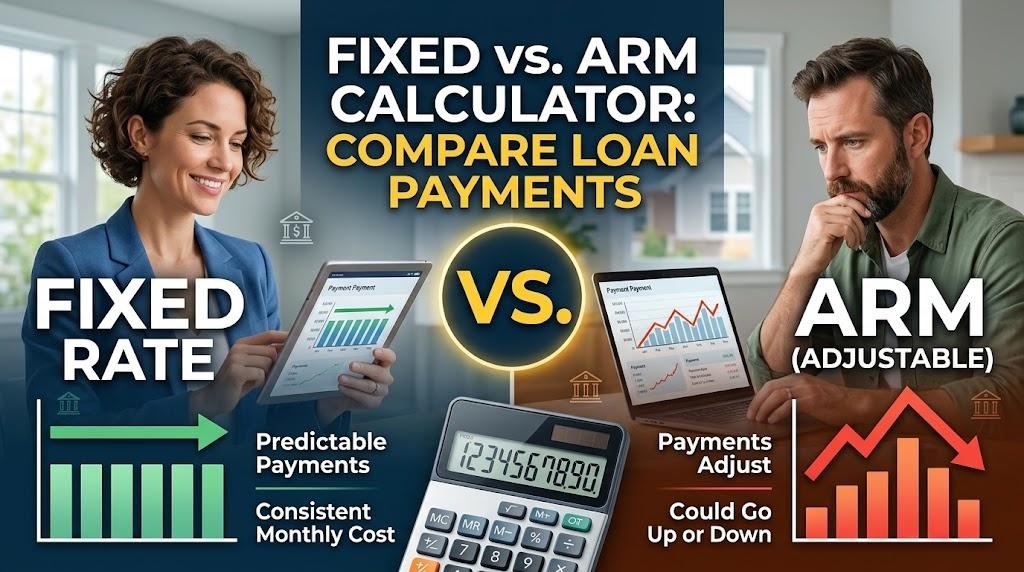
Choosing between a fixed-rate mortgage and an adjustable-rate mortgage (ARM) ranks among the most consequential decisions in home financing. While a fixed-rate loan locks your interest rate and monthly payment for the entire loan term typically 30 or 15 years an ARM offers a lower initial rate that adjusts periodically after a fixed introductory period. The fundamental tradeoff is straightforward: fixed-rate mortgages provide complete payment certainty, while ARMs offer initial savings at the cost of future payment uncertainty. Understanding how to compare these options using a fixed vs arm mortgage calculator helps you quantify this tradeoff and make an informed choice based on your financial situation, ownership timeline, and risk tolerance.
This guide explains how fixed-rate and adjustable-rate mortgages work, how payments are calculated for each, how ARM adjustments function, and how comparison calculators model different scenarios. You'll see detailed hypothetical examples comparing 5/1 ARM vs 30-year fixed and 7/1 ARM vs 30-year fixed options, learn what factors determine whether an ARM or fixed rate is better for your situation, and understand how rate caps protect ARM borrowers from unlimited payment increases. Whether you're evaluating fixed vs adjustable rate options for the first time or reconsidering your mortgage strategy as market conditions change, comparing loan structures with accurate payment calculations provides the foundation for confident decision-making.
How Fixed-Rate Mortgages Work
A fixed-rate mortgage locks your interest rate for the entire loan term commonly 30 years or 15 years in the United States. Your monthly principal and interest payment is calculated at loan origination using the standard mortgage formula and remains unchanged for the life of the loan. If you borrow $320,000 at 6.75% for 30 years, your monthly payment of $2,075 stays exactly $2,075 in month 1, month 180, and month 360. Property taxes and insurance may fluctuate over time, but your principal and interest component never changes unless you refinance.
Key benefits of fixed-rate mortgages:
- Complete payment predictability: You know exactly what you'll pay every month for 30 years, making long-term budgeting straightforward.
- Protection from rate increases: If market interest rates rise dramatically, your rate and payment remain locked at your original terms.
- Simplicity: No need to monitor interest rate indexes, understand adjustment mechanics, or plan for payment changes.
- Long-term financial planning: Fixed payments simplify retirement planning, college savings, and other financial goals.
The tradeoff for this certainty is typically a higher initial interest rate compared to ARMs. Lenders charge a premium for locking rates over long periods, meaning a 30-year fixed rate is usually 0.50-0.75% higher than a 5/1 or 7/1 ARM's initial rate. Whether this rate premium is worth paying depends on how you value payment certainty versus initial savings a calculation a mortgage calculator or fixed rate vs arm mortgage calculator can help quantify.
How Adjustable-Rate Mortgages (ARMs) Work
An adjustable-rate mortgage starts with a fixed interest rate for an initial period typically 5, 7, or 10 years then adjusts periodically based on market interest rates plus the lender's margin. ARMs are named by their structure: a 5/1 ARM has a 5-year fixed period followed by annual adjustments; a 7/1 ARM provides 7 years of rate stability before annual adjustments; a 10/1 ARM locks the rate for 10 years. The initial fixed period gives you payment certainty for a defined timeframe, after which your rate (and payment) can change based on prevailing interest rate conditions.
How ARM rate adjustments work:
- Index selection: Your ARM rate ties to a specific financial index that reflects market interest rates commonly the Secured Overnight Financing Rate (SOFR), U.S. Treasury yields, or the prime rate. When the index moves up or down, your ARM rate follows.
- Margin addition: The lender adds a fixed percentage (the margin) to the index value. For example, if the index is 4.50% and your margin is 2.50%, your adjusted rate becomes 7.00%. The margin never changes it's set at loan origination.
- Rate cap protections: ARMs include contractual caps that limit rate increases:
- Initial adjustment cap: Limits the first rate change after the fixed period (commonly 2% or 5%). A 6% start rate with a 2% initial cap cannot exceed 8% on first adjustment.
- Periodic adjustment cap: Limits subsequent rate changes (typically 2% per adjustment period). After the first adjustment, rates can't increase more than 2% per year.
- Lifetime cap: Sets a maximum rate over the loan's life (usually 5-6% above the start rate). A 6% start rate with a 5% lifetime cap can never exceed 11%.
ARM cap structures are often written as three numbers: 2/2/5 or 5/2/5 (initial cap / periodic cap / lifetime cap). These caps protect you from unlimited rate spikes even if market rates soar, your rate increases are contractually limited. When comparing fixed vs arm rates or using a 7/1 ARM calculator, understanding these caps is essential for modeling worst-case payment scenarios.
How to Calculate and Compare Payments
Both fixed-rate and ARM initial payments use the same standard mortgage payment formula: M = P[r(1+r)^n] / [(1+r)^n - 1], where M is monthly payment, P is principal (loan amount), r is monthly interest rate (annual rate ÷ 12), and n is total number of payments (loan term in years à 12). The difference emerges after an ARM's fixed period ends at that point, the payment is recalculated using the remaining loan balance, the new adjusted interest rate, and the remaining loan term.
Steps for comparing fixed vs ARM payments:
- Calculate initial payments: Apply the mortgage formula to both options using their respective rates. A fixed vs arm mortgage calculator or arm vs fixed rate calculator performs this calculation instantly.
- Model ARM adjustments: Estimate the remaining balance when the ARM adjusts, then recalculate the payment using potential adjusted rates best case (rates fall), moderate case (moderate increase), and worst case (hitting rate caps).
- Compare total costs over your ownership timeline: If you plan to sell in 7 years, compare cumulative costs through year 7, not the full 30-year period. A 5/1 ARM vs 30-year fixed calculator helps visualize these comparisons.
- Identify break-even points: Calculate when ARM payment increases would eliminate initial savings. If you save $200/month for 5 years ($12,000 total) but then pay $300/month more for years 6-10, you'd break even in year 9.
- Stress test scenarios: Model whether you can afford worst-case payment increases. An ARM APR calculator helps estimate composite costs assuming various adjustment patterns.
A comprehensive fixed rate vs arm mortgage calculator should allow you to input different adjustment scenarios rather than assuming rates stay constant. The most valuable analysis compares not just initial payments but total interest paid, required income for qualification, and financial flexibility to absorb payment changes. When evaluating ARM vs fixed rate options, focus on scenarios matching your likely behavior will you actually sell in 5-7 years, or might circumstances change?
Hypothetical Example 1: 5/1 ARM vs 30-Year Fixed
This hypothetical comparison illustrates how a 5/1 ARM's lower initial rate creates payment savings but introduces adjustment risk. All figures are for illustration only actual rates vary by borrower, market conditions, and date.
Common Scenario Parameters:
- Purchase price: $400,000
- Down payment: 20% ($80,000)
- Loan amount: $320,000
- Loan term: 30 years (360 months)
Option A: 30-Year Fixed at 6.75%
- Monthly interest rate: 6.75% ÷ 12 = 0.005625
- Monthly P&I: $2,075
- Payment stays $2,075 all 360 months
- Total interest over 30 years: $427,000
Option B: 5/1 ARM at 6.00%
- Initial monthly rate: 6.00% ÷ 12 = 0.005
- Initial monthly P&I: $1,918
- Years 1-5: Payment stays $1,918
- Savings vs fixed: $157/month
- Total 5-year savings: $9,420
What Happens in Year 6? (Adjustment Scenarios)
After 5 years of payments at 6.00%, the remaining loan balance is approximately $288,000 with 25 years (300 months) remaining. The ARM rate adjusts based on the current index plus margin, subject to rate caps. Assume this ARM has 2/2/5 caps (2% initial adjustment cap, 2% periodic cap, 5% lifetime cap).
Scenario 1: Rates Rise (Adjusted Rate = 7.50%)
- New rate: 7.50% (1.50% increase, within 2% cap)
- New monthly payment: $2,121
- Now paying $46/month MORE than the fixed option
- Year 6 cost: $25,452 vs $24,900 (fixed) = $552 more
- This $552 loss chips away at the $9,420 saved in years 1-5
Scenario 2: Rates Stay Moderate (Adjusted Rate = 6.50%)
- New rate: 6.50% (0.50% increase)
- New monthly payment: $2,038
- Still saving $37/month vs fixed option
- Continue accumulating savings beyond year 5
Scenario 3: Maximum Caps Hit (Adjusted Rate = 8.00%)
- New rate: 8.00% (2% increase, hitting initial cap)
- New monthly payment: $2,205
- Paying $130/month MORE than fixed
- Would eliminate 5-year savings in ~6 years if sustained
This hypothetical 5/1 ARM vs 30-year fixed calculator comparison shows the fundamental tradeoff: $9,420 in guaranteed savings during years 1-5, versus uncertain payments afterward. If you sell or refinance within 5 years, you capture the full savings with no adjustment risk. If you keep the loan and rates rise significantly, you could pay more than the fixed option. A 5/1 ARM vs 30-year fixed calculator helps model these scenarios with your specific loan parameters and rate assumptions.
Hypothetical Example 2: 7/1 ARM vs 30-Year Fixed
A 7/1 ARM provides two additional years of rate certainty compared to a 5/1 ARM, making it a middle ground between maximum initial savings (5/1 ARM) and complete certainty (30-year fixed). This hypothetical comparison uses a larger loan amount to illustrate the dollar impact of rate choices on high-value mortgages. All figures are illustrative only.
Common Scenario Parameters:
- Purchase price: $500,000
- Down payment: 20% ($100,000)
- Loan amount: $400,000
- Loan term: 30 years (360 months)
Option A: 30-Year Fixed at 6.875%
- Monthly interest rate: 0.0057292
- Monthly P&I: $2,629
- Payment unchanged for 360 months
- Total interest over 30 years: $546,440
Option B: 7/1 ARM at 6.125%
- Initial monthly rate: 0.0051042
- Initial monthly P&I: $2,426
- Years 1-7: Payment stays $2,426
- Savings vs fixed: $203/month
- Total 7-year savings: $17,052
What Happens in Year 8? (Adjustment Analysis)
After 7 years at 6.125%, the remaining balance is approximately $362,000 with 23 years (276 months) remaining. Assume this 7/1 ARM has 2/2/5 rate caps. The longer initial fixed period means you've accumulated more savings before facing adjustment risk, but the adjustment dynamics remain similar to the 5/1 ARM.
Worst Case: Hitting Rate Cap (Adjusted Rate = 8.125%)
- New rate: 8.125% (2% increase, maximum initial cap)
- Remaining balance: $362,000
- Remaining term: 23 years (276 months)
- New monthly payment: $2,772
- Now paying $143/month MORE than fixed option
- At this rate, would eliminate 7-year savings in ~10 years
Moderate Case: (Adjusted Rate = 7.125%)
- New rate: 7.125% (1% increase)
- New monthly payment: $2,607
- Still saving $22/month vs fixed option
- Continue building cumulative savings advantage
Best Case: Rates Decline (Adjusted Rate = 5.625%)
- New rate: 5.625% (0.5% decrease)
- New monthly payment: $2,319
- Saving $310/month vs fixed option
- This scenario demonstrates ARM downside protection
The 7/1 ARM provides more certainty than a 5/1 ARM while still offering substantial initial savings in this hypothetical example, over $17,000 in the first 7 years. This structure suits buyers who plan 7-10 year ownership or expect to refinance before year 8. However, the adjustment risk remains: if rates rise significantly and hit caps, you could pay more than the fixed option. A 7/1 ARM vs 30-year fixed rates comparison using a 7/1 ARM calculator helps evaluate whether the extended fixed period and initial savings align with your financial plans and risk tolerance.
Fixed vs Adjustable Rate: Key Considerations
The question "is fixed or adjustable rate better" or "fixed rate vs adjustable rate" doesn't have a universal answer the right choice depends on multiple factors specific to your situation. Here are the key considerations when comparing ARM vs fixed rate options:
Ownership Timeline
Favor ARM if: You plan to sell or refinance within the fixed period (5-7 years). You capture all the initial savings with no adjustment risk.
Favor Fixed if: You plan 10+ year ownership or aren't confident about selling/refinancing. Long-term ownership exposes you to multiple ARM adjustment cycles.
Payment Stability vs Initial Savings
Favor Fixed if: You need predictable payments for budgeting, have limited financial cushion for payment increases, or want to eliminate interest rate risk entirely.
Favor ARM if: You can absorb potential payment increases, value the initial savings, and are comfortable with some payment uncertainty.
Risk Tolerance and Financial Flexibility
Favor ARM if: You have stable income with room for growth, significant emergency savings, and can comfortably afford worst-case payment scenarios hitting rate caps.
Favor Fixed if: Your budget is tight, you're risk-averse, approaching retirement, or your income may not grow proportionally with potential payment increases.
Current Rate Environment
Favor Fixed if: Current mortgage rates are historically low locking in a low rate for 30 years provides long-term value.
Favor ARM if: Rates are historically high and you believe they'll decline, allowing refinancing or favorable adjustments. However, rate predictions are uncertain don't base decisions solely on rate forecasts.
Refinancing Confidence
Favor ARM if: You're confident you'll qualify to refinance before adjustments (strong credit, stable income, building equity).
Favor Fixed if: Your qualification is borderline, you're self-employed with variable income, or you're unsure about future refinancing ability.
Use a fixed vs arm mortgage calculator to quantify these tradeoffs with your specific numbers. Model scenarios matching your likely behavior if you "plan" to sell in 5 years but might stay 10, stress test the ARM across that longer timeline. The goal isn't to predict the future perfectly but to ensure you can handle reasonable worst-case scenarios.
Understanding Break-Even Analysis
Break-even analysis answers a critical question: How long would ARM payment increases need to persist to eliminate the initial savings? This calculation helps you understand whether the ARM's upfront advantage is worth the adjustment risk. Using Example 1 above (5/1 ARM saving $157/month for 60 months = $9,420 total), we can model break-even scenarios.
Break-Even Calculation Framework:
Scenario 1: Moderate Increase ($50/month more than fixed)
Break-even time: $9,420 ÷ $50 = 188 months (15.7 years after adjustment)
Total break-even: 5 years (savings period) + 15.7 years = 20.7 years into the loan
Scenario 2: Significant Increase ($150/month more than fixed)
Break-even time: $9,420 ÷ $150 = 63 months (5.3 years after adjustment)
Total break-even: 5 years + 5.3 years = 10.3 years into the loan
Scenario 3: Maximum Cap Increase ($250/month more than fixed)
Break-even time: $9,420 ÷ $250 = 38 months (3.2 years after adjustment)
Total break-even: 5 years + 3.2 years = 8.2 years into the loan
If you plan to sell in 7-8 years and worst-case rate adjustments would break even at year 8.2, the ARM carries significant risk you might not capture net savings. However, if you're selling in year 6, even worst-case adjustments wouldn't eliminate your cumulative savings. A comprehensive arm vs fixed rate calculator helps model these break-even points across different payment increase scenarios, showing you where your ownership timeline intersects with risk.
Canadian Mortgage Context: Different Structure
Canadian mortgages operate fundamentally differently from U.S. mortgages, making direct comparisons challenging. In Canada, mortgages are structured with separate "terms" and "amortization periods." The amortization is typically 25 years (though it can be 30 years), but you choose a rate term commonly 1, 3, 5, or 10 years for which your rate is fixed or variable. At the end of each term, you must renew (refinance) the mortgage at prevailing rates.
Key differences in Canadian mortgages:
- No true 30-year fixed rate: Canadian lenders don't typically offer rates locked for the full amortization period. The longest fixed-rate terms are usually 10 years, after which you must renew at current rates.
- Fixed vs. variable rate terms: Canadians choose between fixed-rate terms (rate locked for 1-10 years) and variable-rate mortgages (rate fluctuates with prime rate). This is somewhat analogous to U.S. fixed vs. ARM, but the mechanics differ.
- Mandatory renewal: At term end, you must renew your mortgage (or pay it off/refinance elsewhere). This means all Canadian borrowers face periodic rate reset risk, unlike U.S. 30-year fixed borrowers.
- Payment calculation differences: While the payment formula is similar, the shorter terms and mandatory renewals mean Canadian borrowers routinely recalculate payments every few years.
For Canadian borrowers, comparing fixed vs variable rates within a specific term (e.g., 5-year fixed at 5.5% vs 5-year variable at prime - 0.5%) requires different analysis than U.S. ARM vs fixed comparisons. Canadian mortgage calculators must account for renewal scenarios and the fact that no option provides true 30-year rate certainty. The question "should I get a fixed or variable rate mortgage in Canada" focuses on the chosen term length, not the amortization period, making it structurally different from U.S. ARM considerations.
How to Use a Fixed vs ARM Calculator Effectively
A fixed vs arm mortgage calculator or fixed rate vs arm mortgage calculator is most valuable when you model multiple scenarios rather than assuming a single rate path. Here's how to use these calculators effectively:
1. Input Accurate Loan Parameters
Enter your actual loan amount, down payment, and term. Even small rate differences create significant payment variations on large loan amounts $400,000 at 6.5% vs 6.75% is a $62/month difference, or $22,320 over 30 years.
2. Compare Current Rate Quotes
Use actual rate quotes you've received or representative market rates. A 5/1 ARM vs 30-year fixed calculator is only useful if the rates reflect realistic options. Typical spreads are 0.50-0.75% between ARM and fixed rates, though this varies with market conditions.
3. Model Multiple Adjustment Scenarios
Don't assume rates stay flat. Model: (a) rates decrease slightly (best case); (b) rates increase moderately (+1% to +1.5%); (c) rates hit maximum caps (worst case). A 7/1 ARM calculator should show payments across all three scenarios.
4. Focus on Your Ownership Timeline
If you plan to sell in 7 years, compare total payments and interest through year 7, not the full 30 years. The calculator should allow you to see cumulative costs at different time horizons (5 years, 10 years, 15 years, 30 years).
5. Calculate Break-Even Points
Determine how long increased ARM payments would need to persist to eliminate initial savings. If break-even is year 12 but you're selling in year 8, the ARM provides net savings even with rate increases.
6. Include All Costs
Some lenders charge points or fees that differ between fixed and ARM options. An ARM APR calculator incorporates these costs, providing a composite rate that reflects total borrowing cost, not just the note rate.
7. Stress Test Affordability
Calculate whether you can comfortably afford worst-case ARM payments hitting lifetime caps. If maximum payments would strain your budget dangerously, the fixed-rate certainty may be worth the higher initial cost.
A mortgage calculator comparing arm vs fixed rate options provides quantitative analysis, but you must supply reasonable assumptions and scenarios. The calculator shows what happens under different conditions you decide which scenarios are most likely and whether you can handle adverse outcomes. Use the calculator to inform your decision, not to predict the future with false precision.
Understanding ARM Rate Cap Protection
ARM rate caps are your contractual protection against unlimited rate increases. Every ARM must disclose its cap structure upfront, and these limits are legally binding your rate cannot exceed them regardless of how high market rates rise. Understanding cap structure is essential when evaluating ARM vs fixed rate options.
Three Types of ARM Caps:
1. Initial Adjustment Cap
Limits the first rate change after the fixed period ends. Common values are 2% or 5%. A 6% start rate with 2% initial cap cannot exceed 8% in year 6 (for a 5/1 ARM) or year 8 (for a 7/1 ARM), even if market rates spike dramatically.
2. Periodic Adjustment Cap
Limits subsequent rate changes after the initial adjustment. Typically 2% per adjustment period. If your rate is 8% after the first adjustment, it can't exceed 10% at the second adjustment, 12% at the third, etc. subject to the lifetime cap.
3. Lifetime Cap
Sets absolute maximum rate over the loan's life, usually 5-6% above the start rate. A 6% start rate with 5% lifetime cap can never exceed 11%, even if market rates reach 15% and periodic caps would allow higher. This is your ultimate protection.
Example cap structure: 6% start rate with 2/2/5 caps
- Year 8 (first adjustment): Maximum rate = 8.00% (6% + 2%)
- Year 9 (second adjustment): Maximum rate = 10.00% (8% + 2%)
- Year 10 (third adjustment): Maximum rate = 11.00% (6% start + 5% lifetime cap)
- Years 11+: Cannot exceed 11.00% under any circumstances
When using a fixed vs arm mortgage calculator, model worst-case scenarios hitting these caps. Calculate the payment at your lifetime maximum rate and determine whether you could afford it. If worst-case payment at 11% (in the example above) would be unaffordable, you're taking excessive risk with an ARM. The caps provide protection, but only if the maximum payment remains within your financial capacity. Understanding cap structure transforms abstract rate adjustment risk into concrete maximum payment scenarios you can evaluate objectively.
Common Mistakes When Comparing Fixed vs ARM
Borrowers often make predictable errors when evaluating fixed rate vs adjustable rate mortgages. Avoiding these mistakes leads to better-informed decisions:
Mistake 1: Focusing Only on Initial Payment
Choosing an ARM solely because the initial payment is lower ignores adjustment risk. Calculate potential future payments, not just current savings. A $200/month savings that becomes a $300/month increase makes you worse off long-term.
Mistake 2: Assuming You'll Definitely Refinance or Sell
Life circumstances change. Job loss, declining home values, credit problems, or unexpected medical expenses can prevent refinancing or forced early sale. Choose an ARM only if you can afford worst-case adjustments in case you can't refinance.
Mistake 3: Ignoring Rate Cap Structure
Not all ARMs have the same cap protection. A 5/2/5 cap structure provides much more protection than a 2/2/5 structure. Always verify initial, periodic, and lifetime caps before choosing an ARM.
Mistake 4: Treating Fixed Rates as Always Better
The opposite error paying hundreds of dollars per month extra for a fixed rate when you'll definitively sell in 3-4 years wastes money. If your ownership timeline is genuinely short and certain, the ARM's lower rate is financially advantageous.
Mistake 5: Not Stress Testing Worst-Case Scenarios
Failing to calculate maximum possible payment at lifetime cap rates leaves you vulnerable to payment shock. Always determine whether you can afford the absolute worst-case ARM payment before choosing that option.
Mistake 6: Making Rate Predictions
Choosing an ARM because you "think rates will go down" is speculation, not financial planning. Economic forecasts are frequently wrong. Base your decision on ability to handle various scenarios, not rate predictions.
Use a fixed rate vs arm mortgage calculator to model various scenarios objectively, avoiding emotional decision-making or overconfidence in predictions. The right choice balances initial savings against adjustment risk in light of your specific financial situation and ownership plans.
Refinancing Strategies for ARM Borrowers
Many ARM borrowers plan to refinance before the initial fixed period ends or shortly after the first adjustment. While this strategy can work, it requires meeting qualification standards and having favorable market conditions. Here's how refinancing fits into the ARM vs fixed rate decision:
Refinancing scenarios:
- Refinance to fixed before adjustment: If you choose a 5/1 ARM and rates are favorable in year 4-5, refinance to a fixed-rate mortgage, locking in long-term certainty while capturing initial ARM savings.
- Refinance to another ARM: If rates are high at adjustment time, refinance to a new ARM with a fresh fixed period (e.g., new 7/1 ARM), resetting your adjustment timeline.
- Refinance after unfavorable adjustment: If your ARM adjusts upward significantly, refinance to a fixed rate to stop further increases, though you'll pay closing costs.
Refinancing risks and requirements:
- Qualification uncertainty: Tighter credit standards, income changes, or declining home values might prevent refinancing when you need it.
- Closing costs: Refinancing typically costs 2-5% of loan amount in fees $8,000-$20,000 on a $400,000 mortgage. These costs can eliminate ARM savings.
- Interest rate environment: If rates rise dramatically, refinancing might not improve your situation even if you qualify.
- Home equity requirements: Most refinances require maintaining at least 20% equity. Declining home values can trap you in an ARM you can't refinance.
While refinancing is a viable strategy, choosing an ARM while relying on future refinancing introduces compound uncertainty. Use a 5/1 ARM vs 30-year fixed calculator or 7/1 ARM calculator to model scenarios where refinancing isn't possible, ensuring you can handle ARM adjustments if refinancing plans don't materialize. The safest approach: choose an ARM only if you can afford worst-case adjustments without refinancing as your safety net.
Making Your Fixed vs ARM Decision
After understanding how fixed-rate and adjustable-rate mortgages work, analyzing comparison examples, and modeling different scenarios with a fixed vs arm mortgage calculator, you're ready to make an informed decision. Here's a framework for finalizing your choice:
Decision Framework:
Step 1: Define Your Ownership Timeline
Realistically estimate how long you'll keep the property. If genuinely 5-7 years or less, ARMs become more attractive. If uncertain or likely 10+ years, fixed-rate provides certainty.
Step 2: Calculate Maximum ARM Payment
Using a 7/1 ARM calculator or similar tool, determine your payment at the lifetime cap rate. If this worst-case payment is unaffordable or uncomfortably high, choose fixed-rate.
Step 3: Model Break-Even Scenarios
Calculate how long adverse rate adjustments would need to persist to eliminate ARM savings. Compare this to your ownership timeline are you likely to capture net savings?
Step 4: Assess Your Risk Tolerance
How much will payment uncertainty stress you? If rate increases would cause significant anxiety or financial strain, payment certainty is worth the extra cost of fixed-rate mortgages.
Step 5: Consider Refinancing Realistically
Don't assume refinancing will solve problems. Model scenarios where you can't refinance can you still handle ARM adjustments?
Step 6: Compare Current Rate Quotes
Get actual rate quotes for both options. Use a fixed rate vs arm mortgage calculator with these real numbers to see concrete payment differences and savings potential.
Remember that neither choice is universally "better" the question of "is fixed or adjustable rate better" depends entirely on your circumstances. A 5/1 ARM might be perfect for someone planning to sell in 4 years but disastrous for someone who might keep the home 15 years. A 30-year fixed mortgage provides peace of mind for long-term owners but costs someone planning a 5-year ownership thousands in unnecessary interest.
Use the tools available a 5/1 ARM vs 30-year fixed calculator, 7/1 ARM vs 30-year fixed rates comparison, ARM APR calculator, or general arm vs fixed rate calculator to model your specific situation with real numbers. Make your decision based on quantitative analysis of multiple scenarios, not just initial payment differences or speculation about future rate movements. The right choice aligns your mortgage structure with your financial capacity, ownership plans, and tolerance for payment uncertainty.